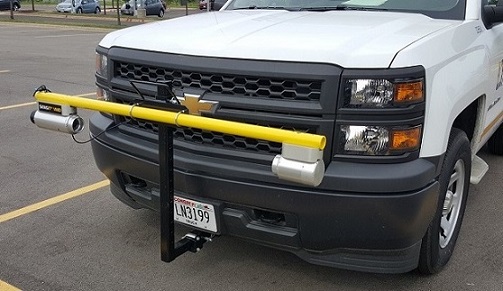
Gas Leak Detection
Designed and developed applications, including a Python add-in tool to show Gas Leak survey results in near-realtime while in the vehicle. Data is stored in an Oracle/SDE database. Office staff use Portal for ArcGIS to view the surveyed data.This new technology is 3 times faster than the old method.
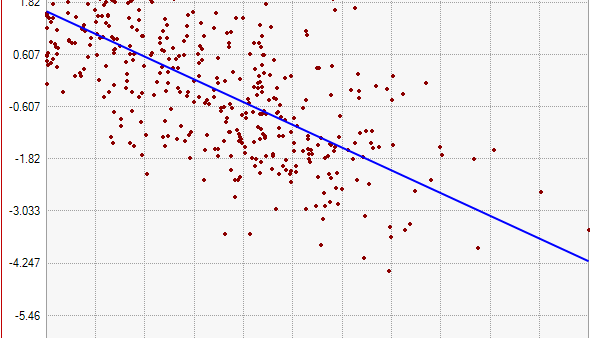
Machine Learning & GIS. Ordinary Least Squares (OLS), Geographically Weighted Regression (GWR)
Current buzz words, but what do they mean? I spent a semester performing advanced Spatial Analysis techniques and intrepeting the results. There is more to pushing the 'Make Hot Spot Map' button in your favorite GIS.
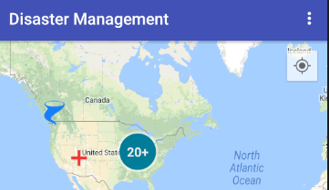
Android Studio, Java, JSP, Servlets, PostgreSQL, PostGIS, Google Maps API
Here is an application that puts many different technologies together. Java and JSP are used to communicate to a Web Server and PostgreSQL database to collect and map disasters using an Android device.
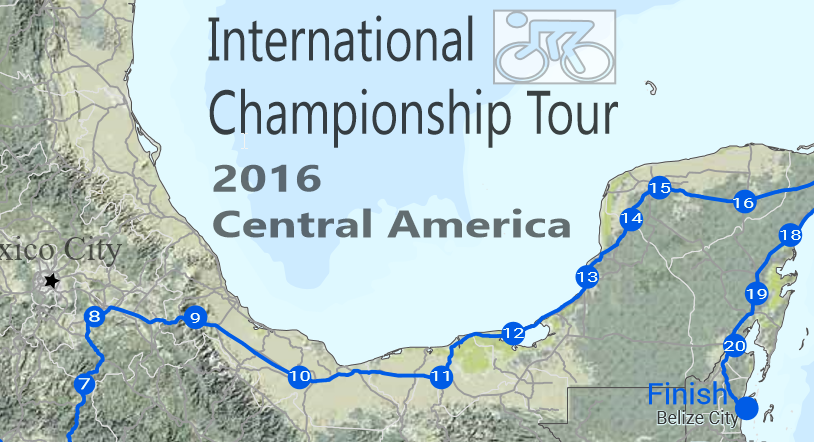
Terrain Map with Bike Route
Here is a terrain map with land cover data to enhance the realism and appeal of the shaded relief map. The bike route was created in Google My Maps. ArcMap, Adobe Photoshop and Adobe Illustrator were used to produce this map.
Antique Mariners Map
CartoCSS and Mapbox Studio Classic were used to replicate the aesthetic style of an antique mariners map from around 1700 and create a Slippy Map.
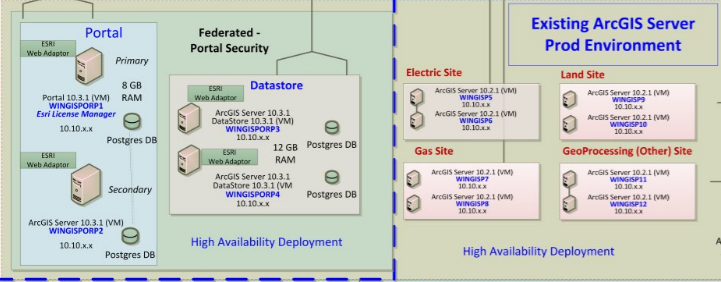
System Architectural Diagram
This is an example of a software and hardware architectural diagram I created to show how ArcGIS Server and Portal for ArcGIS are deployed.
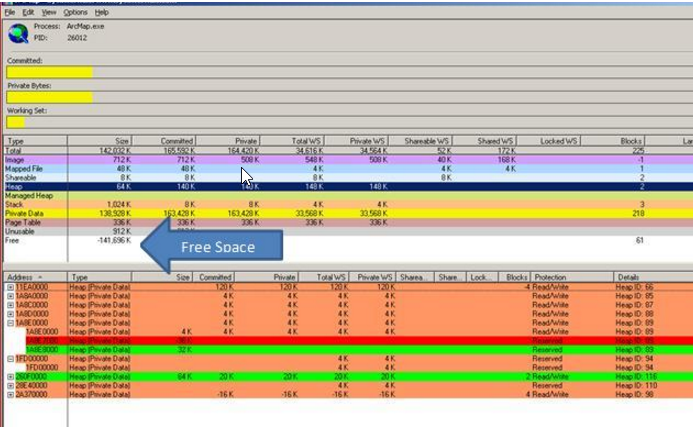
Troubleshooting
Here is an example of using a Microsoft tool called VMMap to troubleshoot why ArcMap 9.3 was crashing or hanging up.
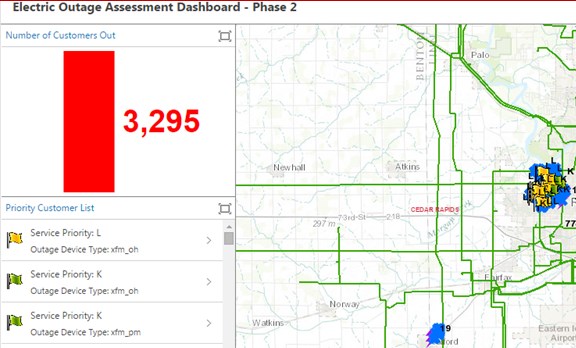
Portal Apps and Map Services
Here is a screenshot of an operations dashboard showing electric outages.
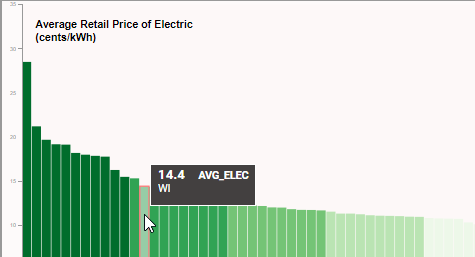
D3 Web Map/Chart Showing Energy Statistics
JavaScript, jQuery and D3 (Data-Driven Documents) used to create an Interactive Energy Statistics Map & Chart
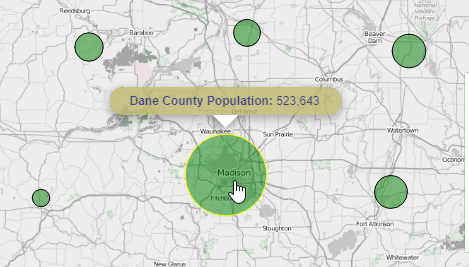
Leaflet Web Map - Wisconsin Population
JavaScript, jQuery and Leaflet used to create an Interactive Wisconsin Population Map
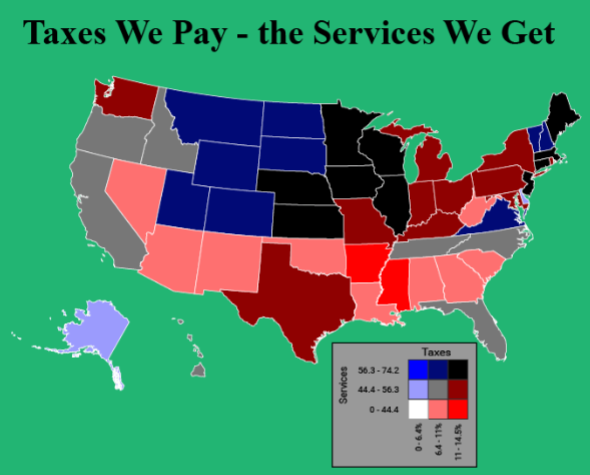
Infographic
Longform Infographic that uses bivariate data to tell a story about the taxes we pay and the services we get in return. Excel, ArcMap, Indiemapper and Adobe Illustrator were used to produce this Infographic.
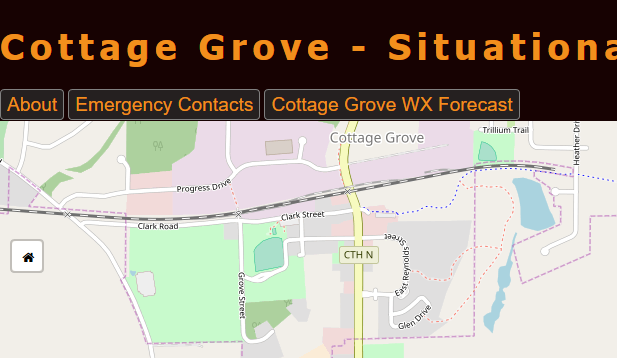
Situational Awareness App Using Leaflet
JavaScript and Leaflet were used to create a Situational Awareness application. Features include: geocoding, identifiy and display current weather radar as a layer.
Gas Distribution Integrity Management Program (DIMP) & National Pipeline Mapping System (NPMS)
Responsible for coordinating and developing several Gas Regulatory projects that integrate with ArcGIS, including NPMS, Uptime.