Infographic
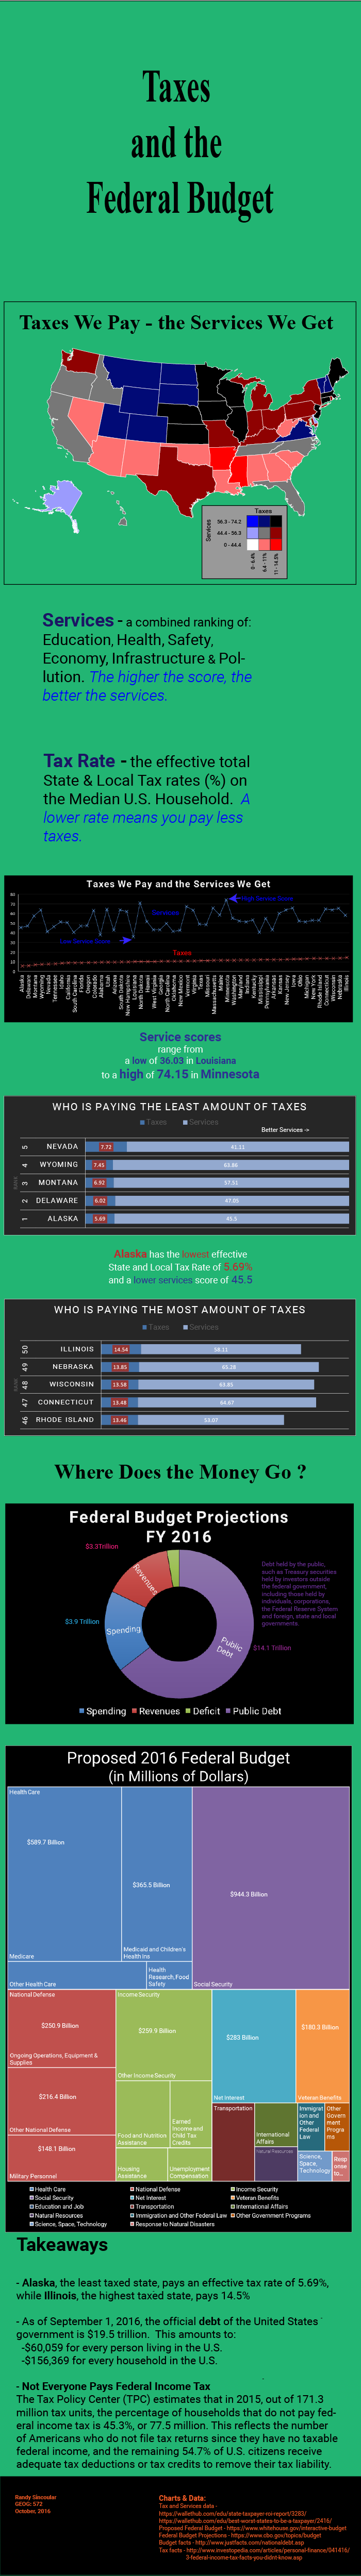
Longform Infographic that uses bivariate data to tell a story about the taxes we pay and the services we get in return. Excel, ArcMap, Indiemapper and Adobe Illustrator were used to produce this Infographic.
Experienced.Innovative.Thorough
Longform Infographic that uses bivariate data to tell a story about the taxes we pay and the services we get in return. Excel, ArcMap, Indiemapper and Adobe Illustrator were used to produce this Infographic.