D3 Application Using JavaScript and jQuery
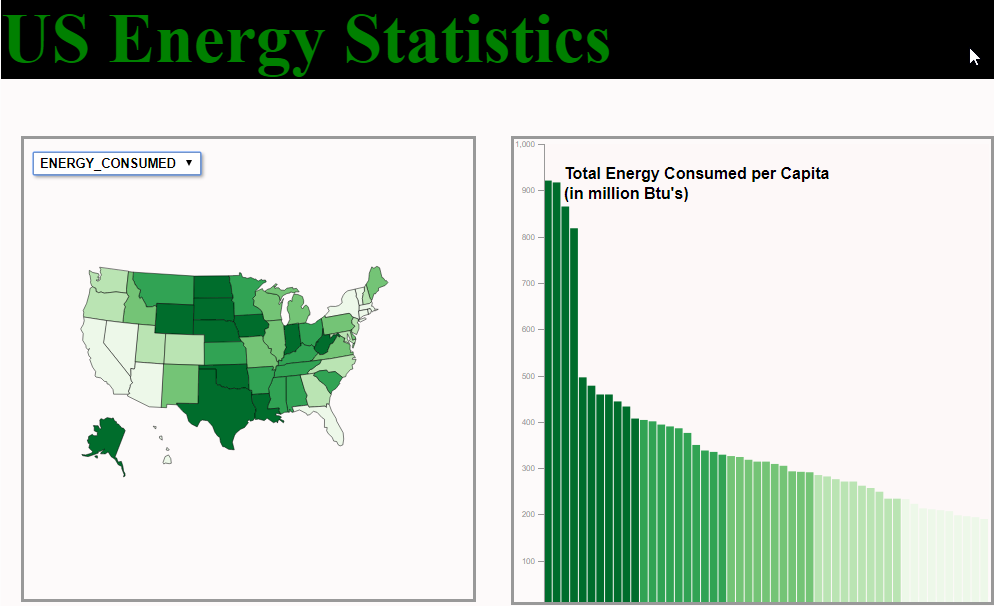
Interactive D3 Web Map showing Energy Statistics for the United States. When you hover over a state, the corresponding record in the chart is also highlighted and vice versa. Data for this application was converted into both topoJSON and geoJSON. JavaScript, D3.js and jQuery was used to build this application.
Left Click on the Map to Display the actual Web Map. *This web map is best viewed on a larger screen since it has not been integrated with Bootstrap.